
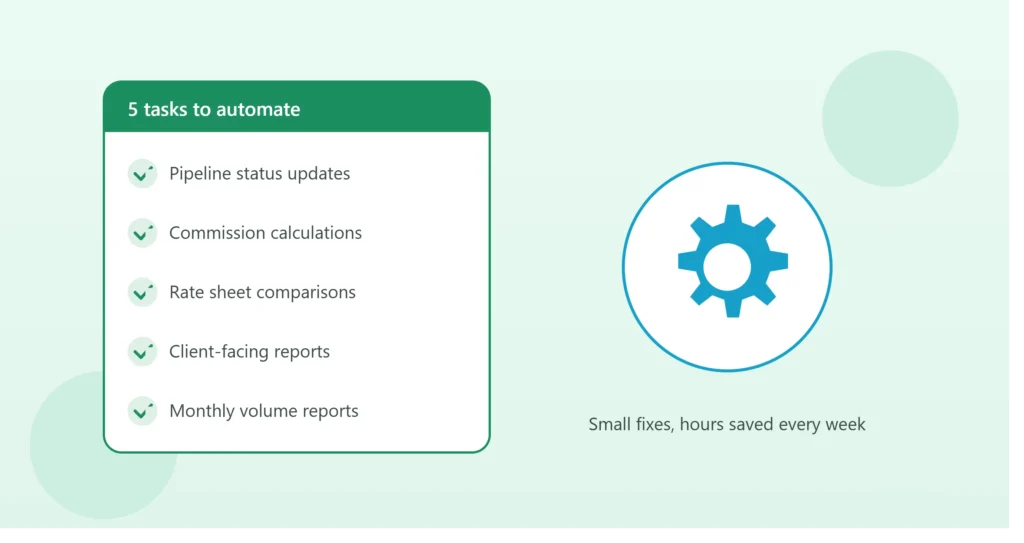
Most mortgage brokers already live in Excel — pipeline trackers, rate sheets, commission calculators, client summaries. The problem isn’t the spreadsheet itself; it’s how much of it still runs on manual updates, copy-paste, and someone remembering to refresh a formula before a meeting.
The good news is that a handful of common broker tasks are especially well-suited to automation — not complex, expensive systems, but targeted fixes that remove the repetitive parts while keeping the flexibility Excel is good for. Here are five worth starting with.
1. Loan Pipeline Status Updates
The manual version: Every time a loan moves from processing to underwriting, someone updates a status column by hand — and on a busy week, that update often lags a day or two behind reality.
What automation looks like: Connecting your CRM (Bonzo, GoHighLevel, or similar) directly to your Excel or Google Sheets pipeline tracker so stage changes sync automatically. Combined with a “days in current stage” formula and conditional formatting, this turns a static list into a live view of exactly where every loan stands — without anyone updating it by hand.
If you haven’t built this yet, our guide to building a mortgage pipeline tracker in Excel is a good starting point before layering automation on top.
2. Commission Calculations
The manual version: At the end of the month (or after every closed loan), someone pulls loan amounts, applies commission tiers or splits, and manually calculates payouts — often re-checking the math twice because errors here directly affect people’s paychecks.
What automation looks like: A structured commission calculator that automatically applies the correct tier, split, or bonus threshold based on loan volume, loan type, or individual agreements — pulling loan data directly from your pipeline tracker rather than re-entering it. Built correctly, this removes both the manual calculation time and the error risk that comes with doing commission math by hand under a deadline.
3. Rate Sheet and Product Comparisons
The manual version: Comparing rates and terms across lenders or loan products often means manually re-typing numbers into a comparison sheet every time rates update — a task that’s tedious enough that it sometimes just doesn’t get done as often as it should.
What automation looks like: A structured rate comparison sheet where updating source data (via import, paste-link, or a light script) automatically recalculates comparisons, highlights the best option for a given scenario, and flags outdated entries. This keeps your comparison tool actually current instead of showing rates from three weeks ago.
4. Client-Facing Reports and Summaries
The manual version: Building a clean, professional-looking loan summary or pre-approval letter for a client means manually formatting a document each time — copying numbers, adjusting layout, double-checking every field.
What automation looks like: A template-driven system where entering (or pulling) a client’s loan data automatically populates a formatted summary or report, ready to export as a PDF or send directly by email. What used to take 15–20 minutes of formatting becomes a few seconds of data entry.
5. Monthly Volume and Performance Reporting
The manual version: Pulling together a monthly report — loan volume, closed deals, pipeline value, average time-to-close — usually means manually compiling numbers from multiple sources, then formatting a summary to share with a broker-owner, lender partner, or your own records.
What automation looks like: A dashboard, built once, that automatically recalculates these metrics from your existing pipeline and closed-loan data — using a Pivot Table or connected data source rather than manual entry. Pair this with an Apps Script automation and the report can even generate and email itself on a schedule, with zero manual work each month.
Why These Five, Specifically
These tasks share three things in common: they’re recurring (so the time savings compound), they’re error-prone under time pressure (commission math and rate comparisons especially), and they’re not particularly complex to automate — meaning the return on setting them up tends to come quickly, often within the first month or two of use.
Compare that to trying to automate something highly variable or one-off — the effort-to-payoff ratio is much better for tasks you repeat every week or every closed loan.
Where to Start
If all five feel relevant, it’s worth prioritizing based on two questions:
- Which task currently takes the most time? Start with the biggest manual time sink.
- Which task causes the most errors or stress under deadline? Commission calculations and pipeline status updates are common answers here, since both directly affect people getting paid correctly and on time.
Most brokers don’t need all five automated on day one. Starting with one — usually the pipeline tracker, since it feeds into several of the others — and expanding from there tends to work better than trying to overhaul everything at once.
A Note on “Automation” vs. “New Software”
None of this requires replacing your existing tools with something entirely new. Excel and Google Sheets remain genuinely capable platforms — what’s usually missing isn’t a better tool, it’s the automation layer connecting your CRM, your spreadsheets, and your reporting so data flows between them without manual re-entry.
If you’d like help identifying which of these five (or something specific to your own workflow) is worth automating first, book a free 15-minute call and we’ll walk through what would save you the most time.