
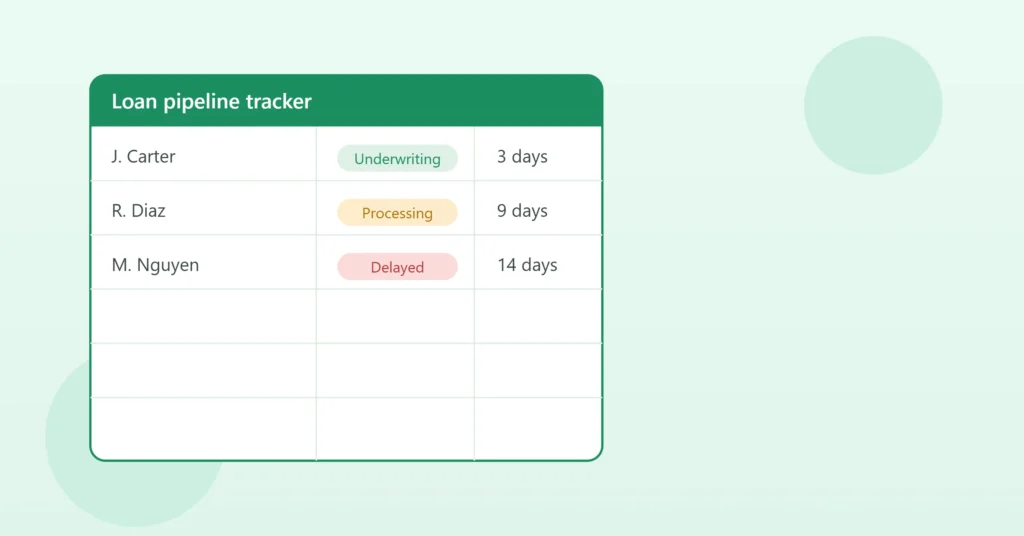
If you’re a mortgage broker or loan officer juggling a dozen files at different stages — pre-approval, underwriting, appraisal, closing — a messy inbox and sticky notes won’t cut it for long. A mortgage pipeline tracker in Excel gives you one place to see exactly where every loan stands, who’s waiting on what, and which files are at risk of falling behind.
The good news: you don’t need expensive loan origination software to get this visibility. A well-structured Excel tracker can do most of the heavy lifting, especially if you’re a solo broker or a small team. Here’s how to build one from scratch.
Why Use Excel for Your Loan Pipeline?
Before jumping into the how-to, it’s worth addressing the obvious question: why not just use your CRM or LOS (loan origination system)?
In practice, most brokers already have a system for compliance and documentation — but that system isn’t always built for a quick, visual overview of the whole pipeline. Excel fills that gap. It’s flexible, it’s something your team already knows, and it can be customized to match exactly how you work, rather than forcing you into someone else’s template.
The trade-off is that a plain spreadsheet with no structure quickly turns into chaos. The key is setting it up properly from the start.
Step 1: Define Your Pipeline Stages
Every mortgage pipeline tracker needs clear, consistent stages. A typical structure looks like this:
- Lead / Inquiry
- Application Submitted
- Pre-Approval
- Processing
- Underwriting
- Conditional Approval
- Clear to Close
- Closed / Funded
- Denied / Withdrawn
Create a column called Stage and use a dropdown (via Data Validation) so every entry is consistent. This matters more than it sounds — inconsistent labels like “Underwriting” vs. “In Underwriting” will break your filters and reports later.
Step 2: Set Up Your Core Columns
At a minimum, your tracker should include:
- Borrower Name
- Loan Number
- Loan Type (Conventional, FHA, VA, etc.)
- Loan Amount
- Stage (dropdown from Step 1)
- Date Received
- Target Close Date
- Days in Current Stage
- Next Action / Follow-Up
- Assigned To (if you work with a team)
- Notes
The “Days in Current Stage” column is one of the most valuable additions. Using a simple formula like =TODAY()-[Date Entered Stage], you can instantly spot files that have been sitting too long — often the first sign of a loan that’s about to fall through.
Step 3: Use Conditional Formatting to Spot Problems Fast
This is where a basic spreadsheet turns into an actual management tool. Conditional formatting lets you visually flag files that need attention without reading every row.
A few useful rules:
- Highlight any row where Days in Current Stage > 10 in red
- Highlight Target Close Date in yellow if it’s within 5 days and the loan isn’t yet “Clear to Close”
- Color-code the Stage column so each stage has its own color, making the whole sheet easier to scan
None of this requires advanced Excel knowledge — Excel’s built-in Conditional Formatting menu handles it with a few clicks.
Step 4: Build a Simple Dashboard View
Once your data is structured, a small dashboard on a separate tab makes the tracker genuinely useful in daily standups or client updates. Using a Pivot Table, you can quickly show:
- Number of loans per stage
- Total loan volume in the pipeline
- Average days per stage
- Loans at risk of missing their closing date
This turns a flat list of loans into an at-a-glance summary — the kind of view that’s normally reserved for expensive CRM dashboards.
Step 5: Automate the Repetitive Parts
A tracker built once and updated manually every day tends to fall apart within a few weeks — someone forgets to update a stage, or a follow-up date slips through. This is usually where brokers hit a ceiling with a purely manual spreadsheet.
Some ways to reduce that manual burden:
- Use Excel formulas to auto-calculate “Days in Stage” and flag overdue follow-ups automatically
- Set up conditional alerts so files that haven’t moved in X days are visually flagged without anyone checking manually
- If your CRM (like Bonzo) already holds borrower and stage data, that information can often be synced into your Excel tracker automatically, so you’re not re-entering the same data twice
That last point is where a lot of brokers eventually look for outside help — not because the spreadsheet concept fails, but because manually keeping two systems in sync becomes its own job.
Common Mistakes to Avoid
- Too many stages. More than 8–9 stages usually makes the pipeline harder to read, not easier.
- Free-text status fields. Always use dropdowns for anything you’ll want to filter or report on later.
- No single source of truth. If loan officers keep their own personal trackers instead of one shared file, you lose the whole point of a pipeline view.
- No automation at all. A tracker that requires perfect manual discipline every day will eventually break down under a busy month.
When It’s Time to Move Beyond a Manual Spreadsheet
A well-built Excel tracker can comfortably handle a solo broker or small team for quite a while. But once you’re managing a higher volume of loans, coordinating with a larger team, or already using a CRM like Bonzo or GoHighLevel, manually keeping the spreadsheet updated becomes the bottleneck rather than the solution.
At that point, the most efficient move usually isn’t to abandon Excel — it’s to automate it. Syncing your CRM directly into your tracker, auto-flagging stalled files, and generating your pipeline dashboard without manual updates can turn the same spreadsheet into a system that runs largely on its own.
If you’d like help setting up a pipeline tracker like this — or connecting it directly to your CRM so it updates automatically — book a free 15-minute call and we can look at what your current process needs.